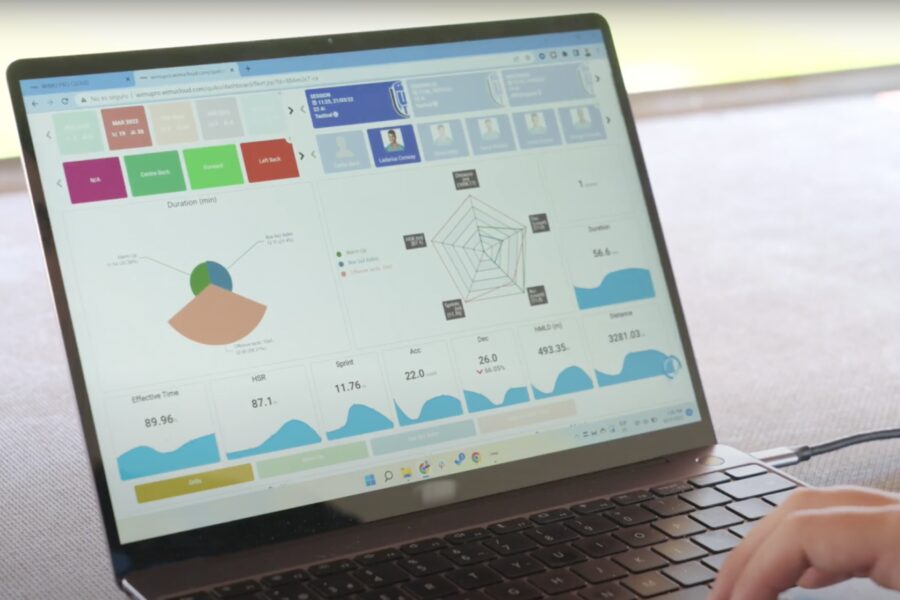
New Reports Now Available in WIMU Dashboards

Performance data is a key element to our users’ workflows—we want to make it as seamless as possible to access and analyze that data. That’s why we’ve revamped our WIMU dashboards in the newest version of WIMU Cloud, which includes the addition of six default reports:
- Daily Report: A comprehensive analysis of the demands and physical performance during each session, giving you better opportunities for observing the success of all the athletes across their tasks.
- Evolutive: This report enables you to assess the evolving physical load of the team or athlete over multiple weeks and sessions, providing valuable insights for evaluation.
- Admin Club: Quantifies and compares the demands and physical performance of different teams within the same organization, offering a comprehensive overview of the organization.
- Athlete Profile: A detailed report of each athlete, capturing data from various types of sessions across weeks and months, to provide a holistic understanding of their performance.
- Match Day: Assesses the physical load of the week(s) leading up to each match day, providing valuable insights into the team’s and each athlete’s readiness and performance levels.
- Task Analysis: A comprehensive and detailed analysis of the physical demands of each task throughout the sessions or weeks. It provides absolute and relative values, allowing for a thorough examination of performance trends.
These six reports cover many of the needs that sports scientists have in their daily routines, helping those users do their jobs more efficiently.
“These new dashboards will help both new and existing users, providing them a solid foundation for learning about the functionalities in WIMU Cloud, and offering pre-defined reports to extract insights without the need to invest time in creating these reports,” said Miguel Ángel Casimiro, Product Manager for WIMU Cloud.
Whether you’re deeply familiar with WIMU or just getting to know the software, with these reports, you won’t have to spend time creating a dashboard from scratch. You’ll now have a starting point to showcase highlights and relevant data, after uploading sessions from SPRO.
And if you’re a new user, these reports will give you a solid foundation for learning about the current available possibilities in WIMU Cloud dashboards, including metrics, visualizations and comparisons.
Though the reports aren’t editable, users can duplicate them and customize all the details of the dashboard in a different report. They’re also shareable in PDF or URL formats. Watch the video below to get all the details.
WIMU Dashboard Release from Hudl on Vimeo.


